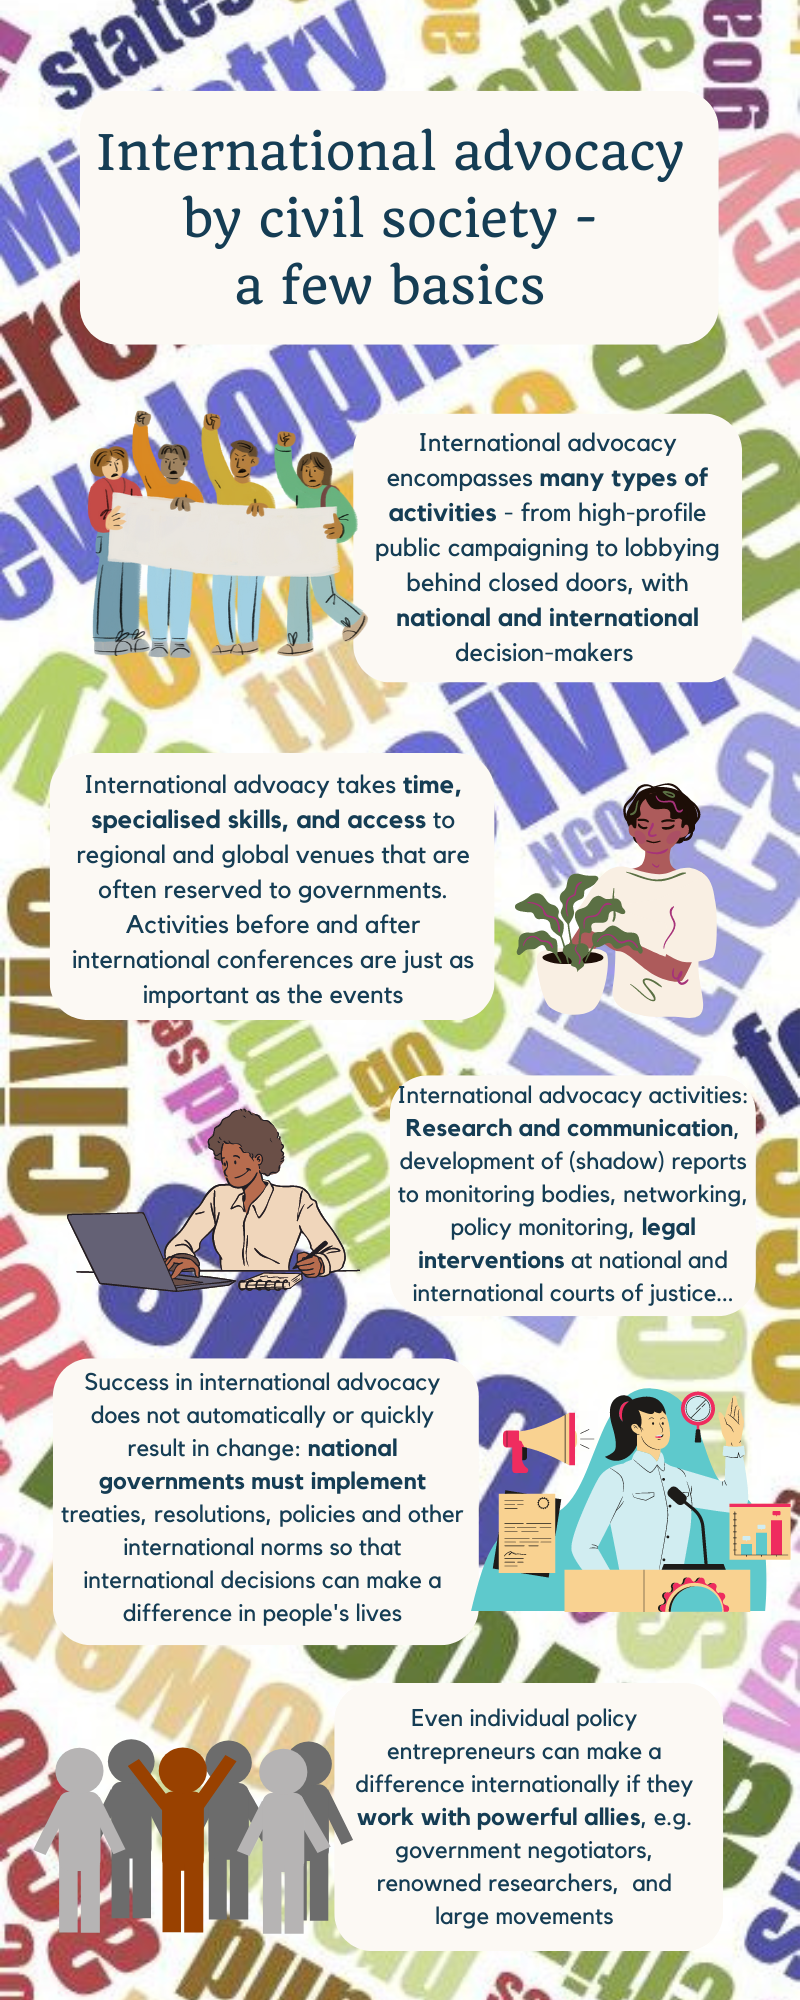
Last year I followed an exhilarating course on qualitative data visualisation with the PME Campus (in German). Among many other things, we learned how to design infographics using online platforms that make it really easy. For the example below, I first created a word cloud based on the short description of a funding scheme for international advocacy. Then, I uploaded the word cloud as a background for my infographic. A bit messy, but fun!